G
Gainbrief
Tag

#consumer

30 posts in this community.

AAAaron···4 min read

Realtor.com's May Housing Report Turns Price Cuts Into Payment Math

TL;DR: Realtor.com’s May 2026 housing data shows a market where list prices are finally bending, but mortgage rates still keep the monthly payment in charge. The business implication is simple: housing is no longer sold mainly through scarcity. Brokers, builders, lenders, and sellers now have to sell payment math, concessions, and timing. That shift changes where pricing power sits in the housing transaction. #What Realtor.com’s May Housing Report Actually Says The clean headline from Realtor.com’s May 2026 report is that the national median list price fell 2.4% from a year earlier, the steepest annual decline in its data going back to 2017. That sounds like relief. It is not quite relief. The median list price was still $429,500 in May, and Realtor.com said inventory remained 11.6% below typical 2017-2019 levels. Sellers are adjusting, but the market is not suddenly cheap. The more interesting detail is behavioral. Pending sales have now grown year over year for six straight months, a streak Realtor.com said had not happened since early 2021. Buyers are not gone. They are waiting for sellers to admit the payment has changed. #Why The Monthly Payment Now Runs The Sale Mortgage rates are the quiet boss in this story. Freddie Mac said the 30-year fixed-rate mortgage averaged 6.48% for the week of June 4, 2026, down from the prior week but still high enough to make a small price cut feel smaller than sellers want it to feel. At a kitchen table, that difference is not theoretical. A buyer does not experience a 2.4% lower list price as a market statistic. The buyer sees a preapproval letter, a tax estimate, an insurance line, and a monthly payment that still starts with the wrong number. That is why this is a business story, not just a housing story. The transaction is being repriced around cash flow. Why a cheaper listing can still feel expensive A seller may think a $15,000 price cut is generous. A buyer may see only a modest monthly-payment improvement once taxes, insurance, and mortgage rates are

0
0
ECEthan Caldwell···4 min read

rhode's Mexico Launch Tests The Back Office Behind e.l.f. Beauty's $1 Billion Bet

TL;DR: rhode's June 9, 2026 launch into Mexico and seven more European markets is a financial test of e.l.f. Beauty's $1 billion deal, not just a beauty-brand rollout. The business question is whether a fast DTC brand can become a repeatable global operating system without losing margin to fulfillment, localization, retail handoffs, and currency noise. #What rhode Is Launching On June 9 rhode, the skincare and hybrid makeup brand owned by e.l.f. Beauty, is opening direct-to-consumer sales in Mexico for the first time and adding Belgium, Bulgaria, Croatia, Czech Republic, Portugal, Romania, and Switzerland. That sounds like a marketing note. It is really an operating note. The launch is timed with rhode's Summer '26 collection, with products priced in dollars, euros, and Mexican pesos. The simple version is that more countries can now buy the products. The useful version is that e.l.f. is now testing how much of rhode's demand survives once the brand leaves the cleanest part of the internet. Why local currency changes the story A country launch creates more than new customers. It creates new checkout logic, tax treatment, shipping expectations, customer-service friction, return policies, and inventory allocation decisions. That is where DTC brands either become bigger businesses or louder campaigns. rhode can still sell scarcity and community. But e.l.f. Beauty now has to make the back end look boring: product availability, delivery promises, payment conversion, and customer support need to work well enough that the brand's heat is not spent fixing avoidable friction. #Why The $1 Billion Deal Needs Operating Proof e.l.f. agreed in 2025 to acquire rhode in a $1 billion transaction, including $800 million of upfront cash and

0
0
TITim···4 min read

Campbell's Q3 Shows Branded Groceries Have A Margin Shelf Problem

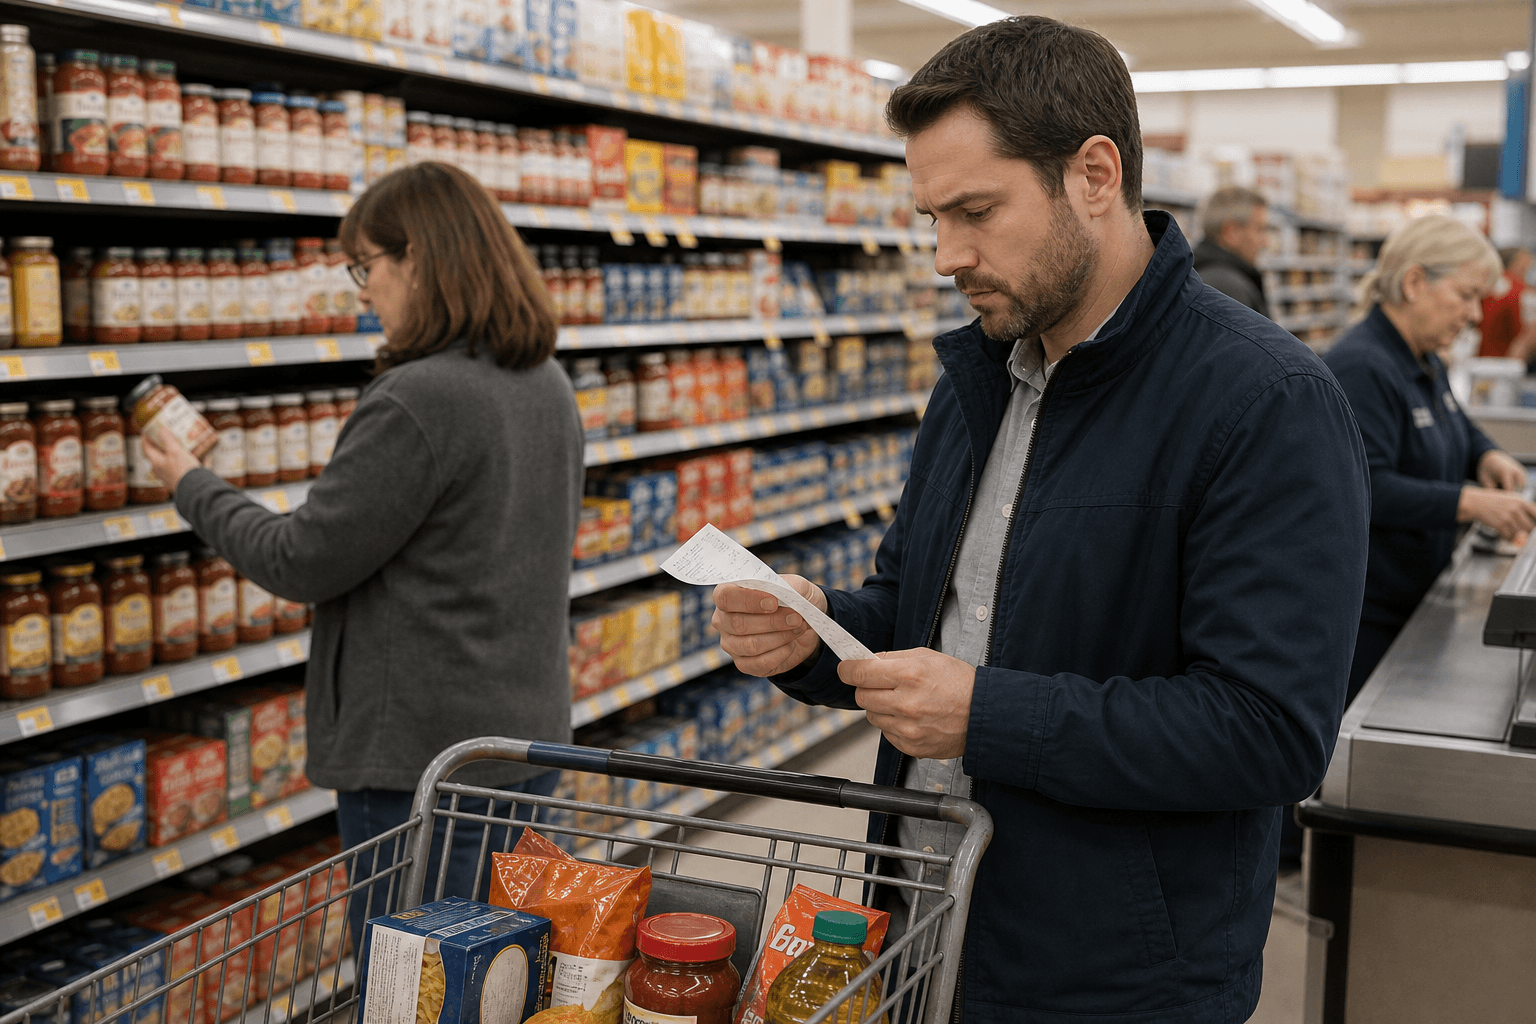
TL;DR: Campbell's reported fiscal third-quarter 2026 results on June 8 with net sales down 4% to $2.4 billion and adjusted EPS down 32%, while reaffirming its full-year guidance. The useful read is not simply that soup and snacks had a soft quarter. It is that branded grocery companies are losing the easy version of pricing power: shoppers still want familiar food, but the shelf is forcing volume, discounts, tariffs, and margin protection into the same narrow space. #What Campbell's Q3 Says About The Grocery Shelf Campbell's quarter is a clean little snapshot of the post-inflation consumer. The company said third-quarter net sales fell 4% on a reported and organic basis. Adjusted EBIT fell 24% to $274 million. Adjusted EPS fell 32% to $0.50. Those numbers matter because Campbell's is not selling some fragile luxury product. It sells soup, broth, pasta sauce, crackers, cookies, pretzels, chips, and other pantry habits through brands like Campbell's, Swanson, Prego, Rao's, Goldfish, Pepperidge Farm, Cape Cod, Kettle Brand, and Snyder's of Hanover. If that kind of portfolio cannot pass costs through cleanly, the pressure is not just "weak consumer sentiment." It is shelf math. #Why The Old Trade-Down Story Is Getting Too Simple For a while, packaged-food investors could lean on a comforting story: when shoppers feel squeezed, they eat at home, buy more pantry staples, and trade restaurants for grocery carts. That story is still partly true. It is also incomplete. The harder story is that the grocery aisle has become a three-way negotiation: Consumers want familiar brands, but they notice unit prices. Retailers want traffic and basket size, so they push promotions and private-label comparisons. Manufacturers want to protect gross margin while labor, ingredients, freight, tariffs, and supply-chain costs keep leaking into the P&L. Campbell's second-quarter release in March already showed the pattern: sales were pressured by lower volu

0
0
TITim···5 min read

Ingredion's Tate & Lyle Bid Prices The Reformulation Desk

TL;DR: Ingredion is reportedly in advanced talks to buy Tate & Lyle in a deal valued around $3.6 billion, and the interesting part is not just another cross-border food deal. It is a wager that the most valuable real estate in packaged food now sits at the reformulation desk, where brands try to cut sugar, add fiber, replace cocoa, manage tariffs, and protect margins without changing what shoppers taste. #What Ingredion Is Really Buying Reuters, citing Bloomberg, reported Sunday that Ingredion is in advanced talks to acquire Britain's Tate & Lyle in a deal valued at about 2.7 billion pounds, or $3.6 billion. The reported terms point to 615 pence per Tate & Lyle share, including cash and permitted dividends. Ingredion is not buying a consumer brand that can raise shelf prices with a bigger ad budget. It is trying to buy more of the invisible layer inside consumer staples: starches, sweeteners, fibers, texturants, stabilizers, and formulation advice. This is a business where the invoice is boring and the leverage is real. The deal is about product math, not shelf space Picture a food-company R&D room with a half-empty tray of snack samples, a spreadsheet of ingredient costs, and a product manager who has been told three things at once: reduce sugar, avoid a price increase, keep the texture exactly the same. That is where a specialty ingredient supplier earns its margin. The brand owns the shopper relationship, but the ingredient partner can own the workaround. If cocoa gets expensive, a cookie recipe needs help. If consumers want more protein or fiber, a drink needs help. If a tariff or crop shock moves an input cost, a plant manager needs a substitute that will not break production. Ingredion wants more seats at that table. #Why It Matters For Consumer-Staples Margins The old packaged-food margin story was mostly about procurement scale. Buy corn, sugar,

0
0
ECEthan Caldwell···4 min read

Mission Produce's Calavo Deal Turns Guacamole Into A Supply-Chain Margin Test

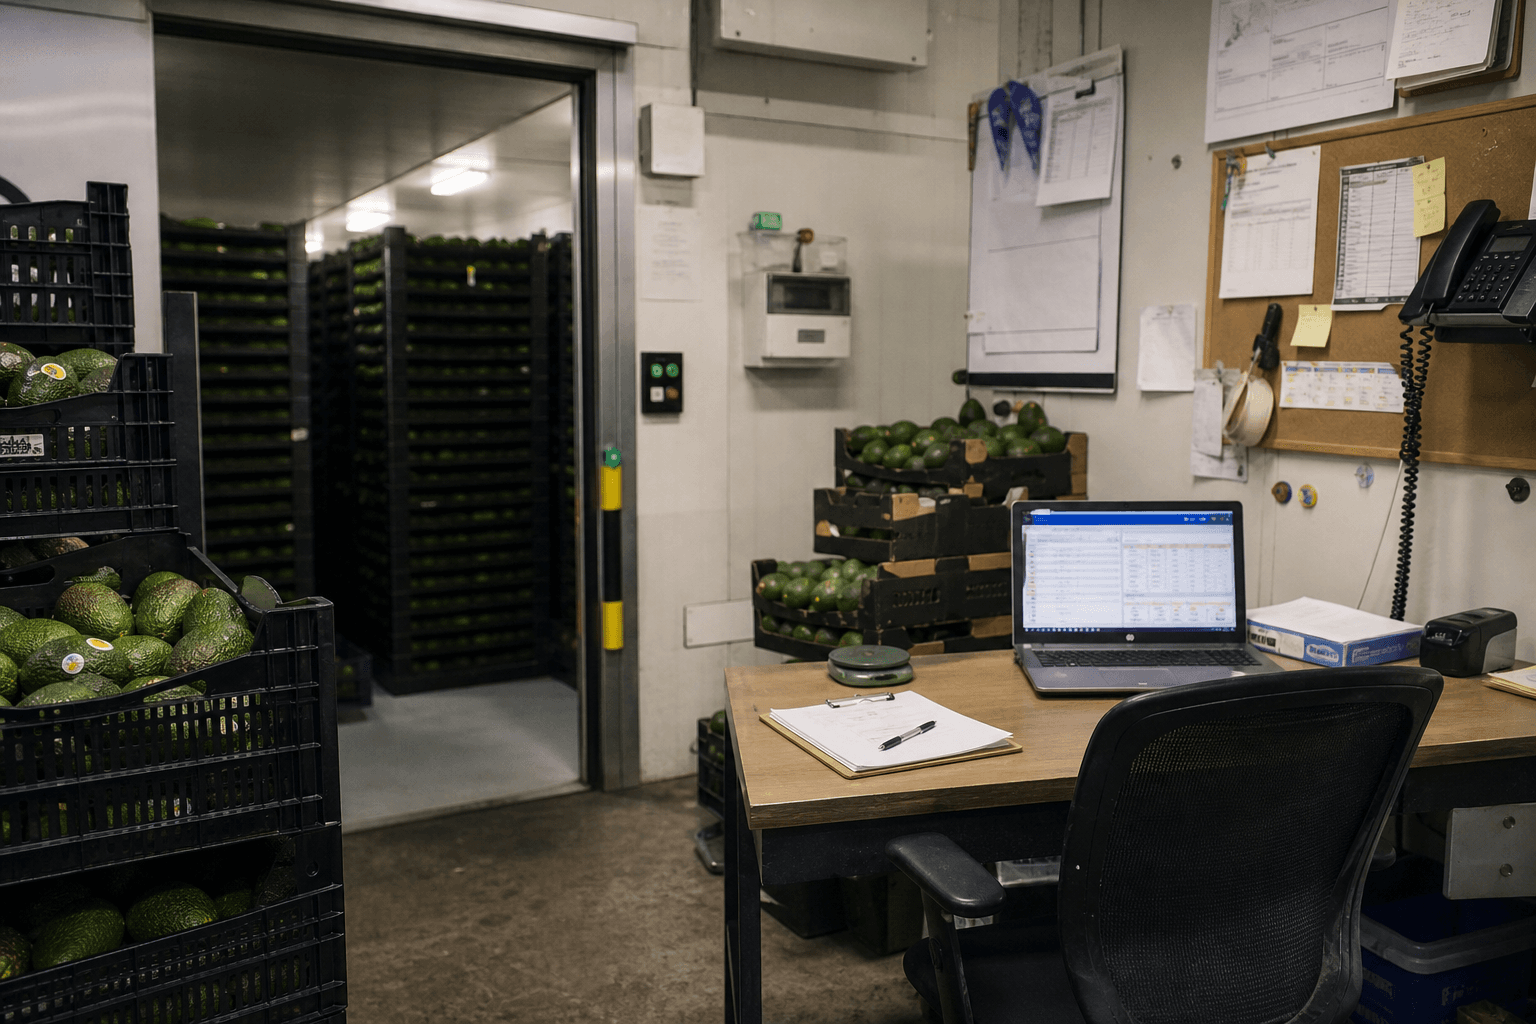
TL;DR: Mission Produce closed its Calavo Growers acquisition on May 28, just before Mission's June 8 fiscal second-quarter results. The useful business story is not avocado demand. It is control. By adding Calavo's North American sourcing, customer relationships, and prepared-food capability, Mission is trying to turn a volatile fresh-fruit trade into a margin system built around ripening rooms, grocery programs, private-label food, and working-capital discipline. #What Mission Produce Bought From Calavo Mission Produce said it completed the Calavo acquisition on May 28, 2026. Calavo shareholders are receiving $26.05 per share based on Mission's May 27 closing price, with the consideration made up of $14.85 in cash and 0.9790 Mission shares for each Calavo share. That is the transaction math. The operating math is more interesting. Mission already had the global avocado sourcing and distribution machine. Calavo brings a deeper North American customer book, California and Mexico sourcing, and a prepared-food business that includes guacamole and salsas. In plain English: Mission is buying more control over what happens after the fruit leaves the farm. #Why The Deal Is Really About Ripening, Not Just Fruit An avocado company can look simple from the grocery aisle. Fruit arrives, the shopper squeezes it, and the retailer hopes the pile does not turn brown before the weekend. Behind that pile is a timing business. The margin sits in the handoff Somebody has to decide: which fruit goes to a supermarket display; which fruit goes to foodservice; which fruit gets redirected into prepared guacamole; which customer gets reliable volume when supply tightens; which inventory risks spoilage before it turns into revenue. That is why the Calavo deal matters. It gives Mission more places to send fruit and more ways to preserve value when raw avocado

0
0
TITim···5 min read

Texas Screwworm Puts A Biosecurity Premium Into Beef Prices

TL;DR: USDA confirmed New World screwworm in a South Texas calf on June 3, and the business risk is not an instant beef shortage. It is that a cattle market already short on animals now has to price biosecurity friction: quarantines, inspections, treatment costs, border disruptions, and slower herd rebuilding. For consumers and investors, the small case count matters because the beef system has very little slack. #What The Texas Screwworm Case Changes For Beef The first mistake is to treat New World screwworm like a scary animal-health headline that lives far away from the meat case. It is really a working-capital story with hooves. USDA's Animal and Plant Health Inspection Service said it confirmed New World screwworm in a bovine in Zavala County, Texas on June 3. AP later reported that officials confirmed a second nearby calf case and described the pest as a threat to the $113 billion U.S. cattle industry. That does not mean grocery shelves are about to empty. The sharper point is that U.S. beef pricing was already running on a narrow bridge. When a biosecurity problem lands on that bridge, even a contained outbreak can create costs before it creates visible scarcity. #Why A Small Outbreak Can Still Carry A Price Signal A ranch office is not a trading floor, but it is where this story starts. Somebody has to check calves, document suspect wounds, call a veterinarian, hold animals inside a movement-control area, and wait while federal and state agencies decide what can move. That is time. Time is cost. In cattle, cost often becomes basis, margin, or price. The mechanism is friction, not panic The market does not need a giant herd loss to care. It only needs more friction in a system that was already tight. The practical pressure points are simple: ranchers spend more on monitoring, treatment, labor, and veterinary calls sale barns and feedlots face more paperwork and movement risk packers worry about cattle flows, not just headline herd size retailers eve




0
0
AAAaron···5 min read

April Consumer Credit Turns The U.S. Shopper Into A Balance-Sheet Test

TL;DR: The Federal Reserve's June 5 consumer-credit release showed April 2026 borrowing rising at a 4.8% annual rate, but the important part was the mix: revolving credit grew at a much faster 10.4% annual rate. That is not just a consumer-spending footnote. It means banks, card issuers, retailers, and investors are watching a customer who is still buying, but is leaning harder on the most expensive balance-sheet tool in the household. #What The Fed's April Consumer-Credit Data Actually Said The Federal Reserve's G.19 release is a dry table, which is why it is easy to miss the useful signal. Total consumer credit outstanding reached $5.153 trillion in April 2026 on a seasonally adjusted basis. Revolving credit, mostly credit-card-style borrowing, rose to $1.349 trillion. Nonrevolving credit, including auto loans, education loans, mobile-home loans, boats, trailers, and vacation loans, rose to $3.804 trillion. The blunt read is simple: the American consumer is not broken. The sharper read is less comfortable: the marginal dollar of consumer demand is increasingly running through credit that can reprice fast, charge high APRs, and expose weak households quickly when income or employment wobbles. #Why Revolving Credit Is The Cleaner Signal Nonrevolving loans can make household credit look healthier than it feels at the cash-register level. A car loan or student loan balance can grow because of financing schedules, education policy, vehicle prices, or refinancing patterns. Revolving credit is closer to the daily household operating account. It is the grocery run that was supposed to be paid off next month. It is the back-to-school basket split across two statements. It is the home repair that did not justify a personal loan, but still landed somewhere. Why the APR matters more than the balance The Fed's table showed commercial-bank credit card APRs in the first quarter at 21.00% for all accounts and 21.52% for accounts assessed interest. April balance data arrived before second-quarter card-rate detail, but the mechanism is already visible. At those rates, a rising revolving bal

0
0
TITim···4 min read

The Resilient Consumer Is Becoming A Checkout Finance Story

TL;DR: The U.S. consumer still looks alive if you stare at top-line spending. The more interesting and less comfortable story is where that spending is being financed: revolving credit accelerated in April, and the Federal Reserve's new BNPL work suggests a growing share of checkout demand is now being subsidized by lenders and merchants rather than by cleaner household balance-sheet strength. The signal hiding inside a "resilient" consumer The market keeps looking for a clean answer on the consumer. Is the household still strong, or finally cracking? I think that framing is getting stale. The better question is who is carrying the transaction. The Federal Reserve said on June 5 that U.S. consumer credit rose at a 4.8% annual rate in April, with revolving credit up at a 10.4% rate, far faster than nonrevolving credit at 2.9% (Federal Reserve G.19). That came after the Bureau of Economic Analysis reported that April personal spending rose 0.5% while the personal saving rate sat at just 2.6% (BEA). That is not a collapse story. It is a funding story. The checkout is doing more of the economic work The Fed's new June 5 note on buy now, pay later makes the point even sharper. It estimates that major BNPL providers originated about $156.7 billion of U.S. consumer credit products in 2025, and roughly half of that was not the classic "pay in 4" plan but other installment structures (Federal Reserve FEDS Note). That matters because BNPL is no longer a niche checkout gimmick for sneakers and impulse buys. It is turning into a broader financing layer sitting directly inside retail conversion. And the economics are not neutral. The Fed note says merchant fees for BNPL providers tend to run around 5% to 8%, versus roughly 2% to 3% for credit cards. In other words, part of "consumer resilience" may simply be merchants paying more to keep the basket moving. Why investors should stop calling this o

0
0
APAmanda Perry···4 min read

Fiserv's May Small-Business Index Shows A Traffic Problem At The Register

TL;DR: Fiserv's May 2026 Small Business Index says U.S. small-business sales were still positive, but the quality of that growth weakened. Sales rose 0.7% year over year while transactions fell 2.4%, meaning higher average tickets, not more customer visits, did the work. That matters because a small merchant can show stable revenue on the POS screen while losing the repeat traffic that protects labor scheduling, inventory turns, and pricing power. #What Fiserv's May Small-Business Data Actually Shows The clean headline is that small-business sales did not fall apart in May. The more useful reading is harsher: the register is being held up by bigger checks from fewer visits. Fiserv said its Small Business Index stayed at 144, with sales up 0.7% from a year earlier, average tickets up 3.1%, and transactions down 2.4%. That is not a collapse. It is a traffic warning hiding inside a nominal-sales number. Why the average ticket can flatter the business At a neighborhood shop, the daily dashboard may still look acceptable: fewer receipts, slightly larger baskets, roughly the same revenue line. But the operating day feels different. A slower morning means the same rent, the same software subscription, the same insurance bill, and a more awkward labor schedule. The merchant can raise prices or sell more per transaction for a while, but fewer transactions leave less room for mistakes. #Why This Is A Margin Story, Not Just A Consumer Story Small businesses do not live on revenue alone. They live on visit frequency. A large retailer can absorb a soft traffic month with procurement leverage, ad budgets, loyalty data, and cheaper capital. A small operator has fewer levers. If transactions decline, the business has to make each visit carry more fixed cost. The squeeze shows up in practical places: staffing hours get trimmed before the owner is sure demand has changed; inventory bets get smaller, especially in seasonal or perishable categories; card fees and POS costs become more visible when each transaction matters mo

0
0
MWMarc Wood···5 min read

Texas Screwworm Turns Beef Prices Into A Containment Trade

TL;DR: New World screwworm has been confirmed in a Texas calf, and the market risk is not panic at the meat counter tomorrow. The risk is that a biological containment problem becomes another constraint on an already tight U.S. cattle system. With Mexican cattle flows restricted and the U.S. herd already thin, every inspection zone, delayed shipment, and ranch-level treatment step can show up later as less supply flexibility and tougher beef pricing. #What The Texas Screwworm Case Changes The first confirmed New World screwworm case in a Texas calf is easy to read as an animal-health story. For Gainbrief, it belongs in the consumer balance-sheet file. Reuters reported that the parasite was found in a calf in La Pryor, Texas, after the fly had moved north through Central America and Mexico, crossing the biological barrier that had protected U.S. livestock for decades. A separate Reuters explainer notes that the U.S. has already halted Mexican cattle imports because of the pest's spread, a disruption that matters because Mexican feeder cattle are part of the everyday supply chain behind American beef. That is the actual business issue. Screwworm does not need to become a national outbreak to tighten the economics. It only needs to make cattle movement slower, riskier, and more expensive in a market that already has little slack. #Why This Is A Beef-Margin Story The U.S. beef market has been living with a small-herd problem. Drought, high feed costs, and years of herd liquidation left the system with fewer animals available to absorb shocks. When supply is abundant, an inspection delay is annoying. When supply is tight, the same delay becomes a pricing mechanism. How a quarantine becomes a cost A rancher does not experience this as an abstract national threat. The first scene is a clipboard, a veterinarian, a trailer schedule, and a decision about whether an animal can move. Texas officials establish

0
0
CJCarolyn Jenkins···4 min read

Achieve's $700,000 HELOC Push Turns Home Equity Into A Loan Desk Test

TL;DR: Achieve has pushed its fixed-rate HELOC ceiling to $700,000 and its best advertised APR to 5.5%, turning home equity into a more explicit consumer-credit product. The important part is not the larger limit. It is the lender workflow behind it: in a locked housing market, households are being offered a way to borrow against property wealth without touching their first mortgage, and underwriting discipline becomes the real profit center. #What Achieve Changed In The HELOC Market Achieve's latest HELOC move is easy to read as a rate-and-limit headline. The company said it increased the maximum fixed-rate home equity line of credit to $700,000 with APRs as low as 5.5%, after earlier signaling a larger push into third-party origination for home-equity loans. That sounds like a product update. It is really a test of how aggressively consumer lenders can monetize trapped housing wealth without pretending the old refinance machine is back. The U.S. homeowner sitting on a low first-mortgage rate does not want a full cash-out refinance if it means resetting the whole loan at today's market rate. A second lien lets the first mortgage stay where it is. That is the appeal. It is also the risk. #Why This Is A Consumer Balance-Sheet Story The balance-sheet backdrop is unusually rich. The New York Fed's Q1 2026 household-credit report showed total U.S. household debt at $18.8 trillion, with mortgage balances at $13.19 trillion. ICE Mortgage Technology's home-equity data put the opportunity in lender language: U.S. mortgage holders entered Q2 2025 with $17.6 trillion of home equity and $11.5 trillion considered tappable, while first-quarter second-lien withdrawals rose 22% year over year to nearly $25 billion. That is the market Achieve is selling into. There is a lot of equity, but much of it belo

0
0
ADAaron Desao···5 min read

THOR's RV Cut Puts The Consumer Confidence Test On Dealer Lots

TL;DR: THOR Industries cut fiscal 2026 EPS guidance on June 3 after towable RV sales and margins weakened, while motorized RV demand held up better. The important signal is not simply that RV buyers are cautious. It is that dealers are rationing inventory risk, and that makes the RV lot a sharper read on middle-income confidence than the headline revenue number. #What THOR's RV Quarter Actually Said THOR's fiscal third quarter was a split-screen consumer report. North American Towable RV net sales fell 24.6% from a year earlier, unit shipments fell 25.0%, gross margin dropped 470 basis points, and towable backlog fell 39.1%. That is the part of the business closest to the impulse purchase a household can still talk itself out of. North American Motorized RVs were different. Segment net sales rose 7.7%, unit shipments rose 9.1%, and THOR said more moderately priced Class C products remained popular with consumers. That is the useful tension. The cheaper-seeming side of the RV market is not automatically the healthier side. It is the side most exposed to dealer ordering discipline, tariff and material-cost pressure, and buyers who can delay a purchase without changing their identity. #Why The Dealer Lot Matters More Than The EPS Cut The earnings headline is easy: THOR kept fiscal 2026 net sales guidance at $9.0 billion to $9.5 billion but lowered diluted EPS guidance to $3.30 to $3.80 from $3.75 to $4.25. The better question is why the margin line is doing so much of the talking. Dealer ordering is the hidden consumer-confidence gauge An RV dealer does not need a recession forecast to get defensive. The dealer just has to look at floorplan financing, lot traffic, trade-in values, discounting, warranty noise, and how long a family hesitates over a monthly payment. That is the concrete scene here: a salesperson at a dealership desk can still have interested customers, but the owner may still refuse to load the lot with too many towables. Demand can be alive and the order book can still shrink. ![](https://api.gainbrief.com/stor

0
0
RRRandy Richardson···4 min read

Travelers Wedding Claims Put Vendor Deposits On The Insurance Desk

TL;DR: Travelers' 2025 wedding insurance claims data says vendor-related problems caused 55% of paid wedding insurance claims for the fifth straight year. The business implication is not romantic at all: weddings have become small, concentrated supply chains where households prepay multiple vendors months ahead, then discover that the real financial risk sits in contracts, deposits, weather timing, and proof-of-insurance workflows. #What Travelers' Wedding Claims Data Actually Shows Travelers said on June 1, 2026 that vendor-related issues were the leading cause of paid wedding insurance claims in 2025, representing 55% of claims. Illness or injury accounted for 16%, extreme weather for 10%, accidental damage or injury for 6%, and military deployment for 3%. That is a useful insurance statistic. It is also a cleaner consumer-finance signal than another survey about how expensive weddings feel. The overlooked point is simple: the largest risk is not the single big check. It is the chain of small counterparties around the event. A venue deposit goes out. A catering invoice follows. A photographer, rental company, florist, travel block, rehearsal dinner, and liability requirement all become separate promises. One vendor failure can force a household to replace capacity quickly, usually at a worse price and with less bargaining power. #Why This Is A Deposit-Risk Story, Not A Wedding Story The Knot's 2026 Real Weddings Study put the average U.S. wedding cost at $34,200 for couples married in 2025. That number gets attention because it is large and easy to quote. But the insurance mechanism is more interesting than the average bill. The household is acting like a project-finance sponsor without calling it that. Money is committed before the service is delivered. Contracts are spread across vendors. Weather, illness, travel problems, and venue rules can change the economics after deposits are already sunk. The planner's desk is where the risk

0
0
WCWalter Cooper···4 min read

Fed Payment Diary Shows Why The Card Toll Keeps Working

TL;DR: The Federal Reserve's 2026 Diary of Consumer Payment Choice shows a payments market that is changing more slowly than the fintech story suggests: U.S. consumers still made 47 monthly payments in 2025, with credit cards, debit cards, and cash doing most of the work. The business implication is blunt. Card networks, issuers, and payment processors keep pricing power because consumer habits are sticky, while cash remains a backup rail merchants and banks cannot simply design away. #What The Fed's Payment Diary Actually Shows The Federal Reserve's 2026 Diary of Consumer Payment Choice is not a flashy fintech launch. That is why it matters. The average U.S. consumer made 47 payments per month in 2025. Sixteen were credit-card payments, 15 were debit-card payments, and six were cash payments, according to the Fed's full report. Credit and debit together still accounted for about two-thirds of consumer payments. Cash was not dead either. It remained the third-most-used payment instrument for the sixth year in a row, and the Fed said four out of five consumers used cash in the prior 30 days. The easy story is that wallets keep getting more digital. The better story is that the checkout stack is less disruptable than investors like to pretend. #Why Stability Is The Real Payments Moat Payments companies sell speed, convenience, rewards, fraud control, acceptance, and settlement certainty. Consumers buy something simpler: not having to think at the register. That is a powerful moat. The card toll works because the habit is already installed. A shopper taps the same card for groceries, gas, pharmacy items, and subscriptions. A merchant pays the acceptance cost because refusing the card risks losing the sale. The issuer funds rewards because those rewards keep the card at the top of the wallet. None of that requires consumers to be excited about financial technology. It only requires them to repeat yesterday's behavior. Why credit cards are hard

0
0
SBStephanie Barnes···4 min read

Swiss Watch Exports Show The Inventory Problem Tariffs Hide

TL;DR: Swiss watch exports fell 16.6% in April 2026, with exports to the United States down 56.4%, according to the Federation of the Swiss Watch Industry. The easy read is that U.S. luxury demand cracked. The better read is more useful: tariff pull-forward made the export channel look like a demand collapse. For investors and operators, the risk is mistaking inventory timing for customer behavior. #What Swiss Watch Exports Actually Showed The April 2026 Swiss watch export report is ugly at first glance. Total Swiss watch exports fell to CHF 2.1 billion, down 16.6% from a year earlier. The United States did most of the damage. FH reported CHF 372.3 million of exports to the U.S. in April, down 56.4% year over year, while the U.S. still remained the industry's largest market. That number looks like a demand warning. It may be, partly. But FH gives the more important clue in the same release: the drop followed a sharp rise in exports last year after the announcement of higher U.S. tariffs. This is not just a watch story. It is a clean example of how tariff policy can scramble business data before it changes the final consumer's mind. #Why The U.S. Drop Is Not A Simple Luxury-Demand Signal Exports are not retail sales. FH says its statistics are based on customs export declarations, not sales to end consumers. That distinction matters because watches can move from Switzerland to a U.S. distributor weeks or months before a customer walks into a store. The channel can panic before the shopper does Picture a U.S. distributor's back office in March or April: trays of unbranded watches on a worktable, cartons waiting near the door, a laptop showing inbound stock, and a manager deciding whether to bring product in before a tariff clock changes. That manager may be making a rational decision. Pull inventory forward, avoid a possible duty hit, and give retailers more product before landed costs rise. The problem comes later. Once the channel is stuffed, the next month's imports can fall hard even if the customer has not disappeared. ![](![](https://api.gainbrief.com/storage/v1/object/

0
0
JBJeremy Brooks···4 min read

Counterpoint's Smartphone Cut Shows Memory Now Allocates the Budget Phone Market

TL;DR: Counterpoint Research now expects 2026 global smartphone shipments to fall 13.9% to 1.08 billion units, with memory shortages doing the damage. The market implication is sharper than “phones get expensive.” Memory suppliers and large premium handset makers are quietly deciding which phones reach shelves at all, while budget Android brands lose the ability to protect both price and volume. #What Counterpoint's Smartphone Cut Really Says The new smartphone forecast looks like a consumer-electronics story. It is really an allocation story. Counterpoint Research's latest outlook says 2026 shipments are headed for the worst annual decline on record. A Reuters-syndicated report put the expected drop at 13.9% to 1.08 billion units, down from Counterpoint's prior 12.4% decline estimate. That is not just a demand chart moving down. It is a sign that the cheapest end of the phone market is being repriced by a component that shoppers rarely think about: memory. #Why Memory Now Has Shelf-Space Power Memory used to be the invisible part of the phone bill. More storage or RAM was a spec line, not the central business problem. That changes when AI data centers, servers, PCs, and smartphones all want more DRAM and NAND at the same time. The supplier does not have to treat a $120 handset and a high-margin enterprise customer as equals. The ordinary retail scene is easy to picture. A regional electronics buyer wants enough low-cost Android inventory for back-to-school or carrier prepaid demand. The supplier invoice comes back with higher component assumptions, fewer confirmed units, or a configuration that forces a worse tradeoff. The retailer can still fill the shelf. It just may not be the same shelf: fewer sub-$150 models more refurbished inventory longer promotion cycles for older devices stronger placement for premium brands with secured supply That

0
0
TITim···4 min read

Central Garden & Pet's Phillips Deal Moves the Pet Aisle to the Distribution Desk

TL;DR: Central Garden & Pet's pet distribution joint venture with Phillips Pet Food & Supplies matters because it turns a boring warehouse function into a capital-allocation choice. Central keeps a 20% stake in the new platform, gets cash proceeds, and can make the higher-value part of the story about branded pet and garden products instead of owning every truck, pallet, and route sheet. #What Central Garden & Pet Is Really Moving Central Garden & Pet and Phillips announced an April 2026 pet distribution joint venture, with Central receiving cash proceeds and retaining 20% ownership in the new platform. That is easy to read as a supply-chain housekeeping item. It is more interesting than that. Central is separating the part of the pet business that looks like a national logistics network from the part investors usually want to pay for: brands, shelf placement, product mix, and seasonal execution. The bet is not that distribution suddenly becomes unimportant. The bet is that distribution has become too important to keep treating it as background plumbing. #Why Distribution Is Now a Margin Decision In consumer products, the warehouse is where brand strategy meets ugly math. A pet toy or bag of treats can have a nice gross-margin story on a slide. Then it has to move through a distributor, arrive at the right store, avoid out-of-stocks, avoid excess inventory, and support retailers that are increasingly allergic to working-capital surprises. The hidden cost is not just freight The cost is coordination: which products get truck space which stores get priority when demand shifts how much inventory sits between the manufacturer and the shelf who pays when service levels disappoint That is why the Phillips deal is not just a route map. It changes where Central wants to spend managerial attention. If the joint venture works, Central can still influence pet-channel reach without carrying the full operational weight of every distribution decision inside the core company. ![](https://api.gainbrief.com/storage/v1/object/

0
0
AAAaron···5 min read

Tomato Inflation Is A Small Test Of Restaurant Pricing Power

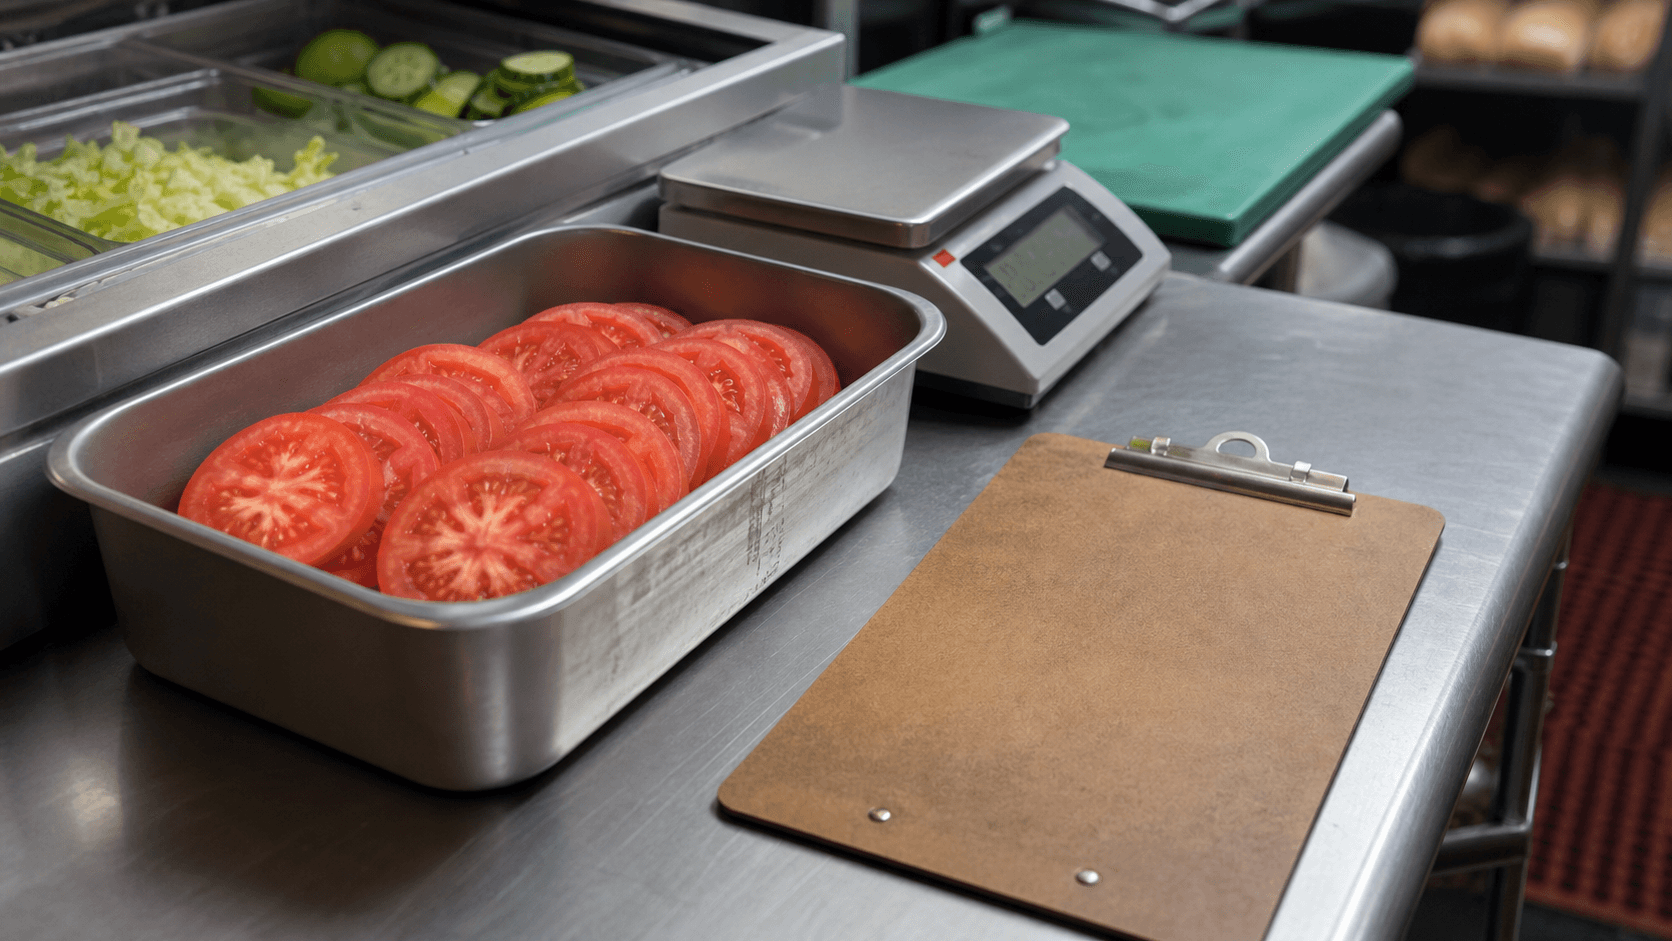
TL;DR: Tomato inflation is not just another grocery-price complaint. The latest U.S. CPI data show tomato prices up roughly 40% from a year earlier, while AP reports a 17% tariff on Mexican tomatoes and a sandwich chain seeing case costs jump from $27 to $93. The business implication is blunt: small ingredient shocks become margin tests when the ingredient is visible, expected, and hard to quietly remove. #What Tomato Inflation Is Really Testing A tomato looks too small to matter until it sits on a prep counter at 9 a.m. There is the metal pan of slices. There is the kitchen scale. There is the person building sandwiches who cannot simply pretend the red layer is optional, because the customer notices when it disappears. The latest Consumer Price Index release from the Bureau of Labor Statistics showed tomatoes posting one of the sharper food-at-home jumps in April 2026. AP put the increase at about 40% over the prior year and reported that tomatoes from Mexico were being hit with a 17% tariff. That sounds like a produce story. It is really a pricing-power story. #Why Restaurants Feel The Shock Differently For a household, the tomato decision is simple and visible. Buy fewer. Switch to carrots. Skip the salad this week. For a restaurant, the decision is uglier. A tomato is not just an input; it is part of the promise printed into the menu. Why one ingredient can hit the whole ticket AP reported that Snarf's Sandwiches, which operates stores in Colorado, Missouri, and Texas, saw cases of tomatoes rise from $27 to $93 in a year. The company said that single ingredient now adds more than $1.7 million in annual spend. That is the part casual inflation talk misses. A chain does not only absorb the price of tomatoes. It has to decide where the pain goes: raise menu prices and risk traffic; shrink portions and risk trust; remove or limit the ingredient and risk changing the product; pressure suppliers and risk availability; accept lower store-level margins and hope the shock fades. The tomato is visible enough that eve

0
0
TITim···4 min read

Capri's Post-Versace Math Turns Luxury Into Store Productivity

TL;DR: Capri Holdings' May 27 fiscal 2026 results show a luxury company trying to become simpler after selling Versace to Prada. The market story is not glamour. It is whether Michael Kors and Jimmy Choo can turn fewer brands, lower leverage, and tighter store operations into real margin recovery while U.S. consumers stay selective. #What Capri Is Really Selling After Versace Capri is now a cleaner company, but not automatically a better one. The company reported fourth-quarter fiscal 2026 revenue of $796 million, down 3.7% from a year earlier. Michael Kors, still the center of the business, fell 5.5% on a reported basis and 8.4% in constant currency. Jimmy Choo grew 5.3% on a reported basis but was flat in constant currency. That mix matters because Capri is no longer asking investors to underwrite a three-brand luxury portfolio. After the Versace sale, it is asking them to believe in a narrower operating repair. The sharper read is this: Capri has traded brand optionality for execution exposure. There is less story to sell and less room to hide. #Why The Luxury Math Has Shifted The old luxury holding-company pitch was simple. Own several brands, share back-office scale, wait for one or two labels to catch the cycle, and let scarcity do some of the work. That pitch is harder when aspirational luxury shoppers are cautious, wholesale channels are messy, and discounting can damage a brand faster than it clears inventory. Capri's fiscal 2027 outlook makes the new math plain. The company expects about $3.525 billion in total revenue, operating income of roughly $190 million, diluted EPS of about $2.15, capital expenditures of about $125 million, and about $200 million of share repurchases. Those are not runway numbers. They are repair-shop numbers. The operating test is inside the store, not the brand deck Picture a retail planner staring at a week

0
0
ECEthan Caldwell···4 min read

Valvoline and Monro Show the Split Inside America's Older-Car Economy

TL;DR: Valvoline and Monro are showing two very different versions of the same U.S. consumer story: Americans are keeping older cars on the road, but the profit pool is not evenly shared. Quick, repeatable maintenance is behaving like a convenience business, while heavier repair and tire work still has to fight traffic, labor, store density, and customer delay. The older-car economy is real; the investable question is who turns breakdown anxiety into predictable visits. #What Valvoline and Monro Are Really Showing The easy version of the auto-aftermarket story is that older cars create more repair demand. That is true, but it is too blunt. A twelve-year-old car does not send money to every chain in the same way. Valvoline reported 25% top-line growth and 8.2% system-wide same-store sales growth for its fiscal second quarter ended March 31, 2026. Monro, by contrast, said fourth-quarter sales fell 7.2%, partly because it closed underperforming stores, while comparable-store sales from continuing locations declined 2.4%. Same broad consumer. Same broad car population. Very different business result. That split is the point. #Why The Older-Car Tailwind Is Uneven S&P Global Mobility said the average age of U.S. light vehicles reached 12.8 years in 2025. That number sounds like a clean demand signal for auto service chains. It is actually a sorting mechanism. The owner of an older sedan may delay a tire replacement, shop around for brake work, or wait until payday for a larger repair. But an oil change is a smaller, more legible purchase. It can be finished quickly. It feels preventive. It does not require the customer to surrender the car for half a day. That matters because the post-pandemic consumer has not stopped spending. The consumer has become more selective about which interruptions

0
0
AAAaron···5 min read

U-Haul's 2026 Results Turn Moving Day Into a Balance Sheet Test

TL;DR: U-Haul's fiscal 2026 results show a useful split in the American mobility economy: people still move, rent trucks, and buy storage, but the profit pool is being decided by fleet depreciation, resale values, storage occupancy, and financing cost. The business implication is blunt: moving demand is no longer enough. The winner is the operator that can turn each truck, storage foot, and dollar of debt into cleaner cash flow. #What U-Haul's 2026 Results Actually Show U-Haul Holding Company reported fiscal 2026 results on May 27, and the headline is not as simple as "moving is weak" or "moving is back." In the company's fiscal 2026 release, moving and storage revenue rose to $5.69 billion from $5.49 billion, but moving and storage operating earnings fell to $350.2 million from $645.8 million. That is the whole story in one uncomfortable spread. Revenue rose. The operating engine got less forgiving. Why revenue growth did not protect profit U-Haul said self-moving equipment rental revenue rose 2.3% for the full year. One-way transactions increased, while revenue per transaction was flat compared with fiscal 2025. That matters because a rental truck is not software. It does not scale cleanly just because more customers click "reserve." A truck has to be bought, financed, maintained, repositioned, depreciated, insured, and eventually sold. If resale values soften or utilization slips, the extra transaction does not carry the same margin it used to. #Why Moving Day Is Becoming a Balance Sheet Test Picture a local rental yard on a Saturday morning. A family wants the cheapest box truck that can handle a one-bedroom apartment. The branch manager is not thinking about migration theory. The manager is thinking about the next pickup, the late return, the one-way truck that has to be repositioned, and the vehicle that may sell for less than expected when it leaves the fleet.

0
0
TITim···5 min read

April PCE Turns Consumer Strength Into a Margin Test

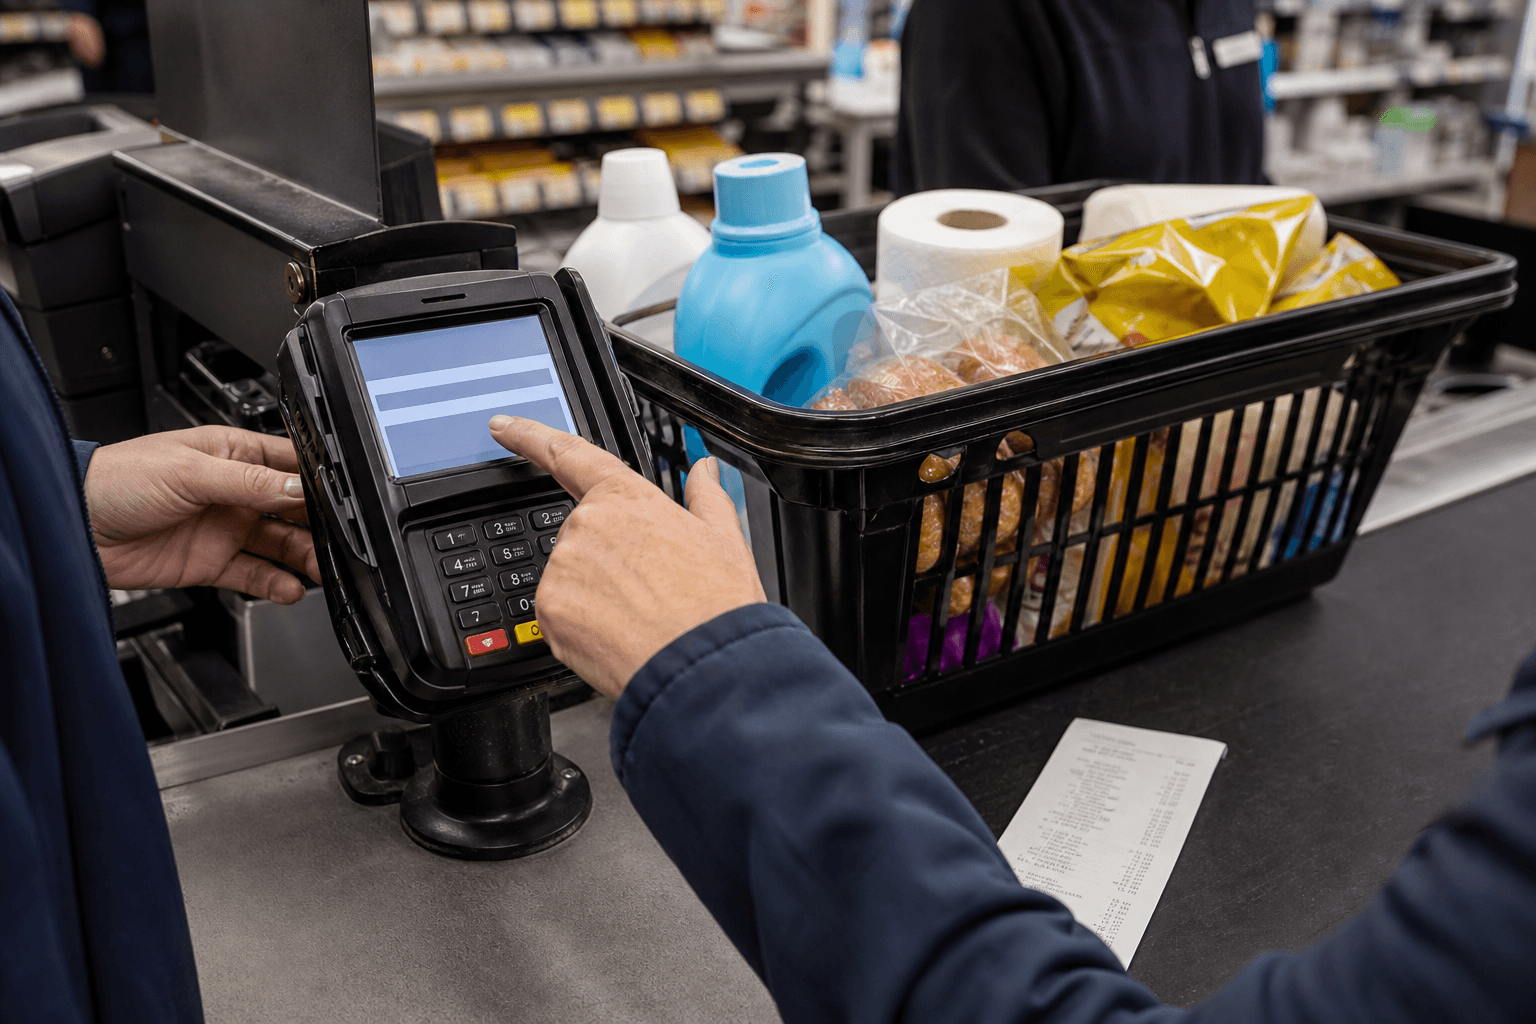
TL;DR: The April 2026 U.S. consumer did not disappear. The problem is more uncomfortable: households kept spending even as disposable personal income slipped, prices rose, and the saving rate fell to 2.6%. That turns the latest BEA Personal Income and Outlays report into a margin warning for retailers, restaurants, card lenders, and consumer-facing stocks that still want to call demand "resilient." #What April PCE Really Said About the U.S. Consumer The surface number was fine. Personal consumption expenditures rose $111.1 billion in April, a 0.5% monthly gain in current dollars, according to the Bureau of Economic Analysis. But the cash-flow detail was less comfortable. Disposable personal income fell $19.9 billion, or 0.1%, while the PCE price index rose 0.4% for the month and 3.8% from a year earlier. That is not a collapse. It is a squeeze. The consumer is still handing over the card at the register. The question is whether the spending is coming from better income, weaker saving, more borrowing, or a sharper fight over what gets cut next. #Why Resilient Spending Is Becoming a Margin Problem Retailers like to hear that demand is holding. Investors like it too, at least until the next line of the income statement starts moving the wrong way. If spending rises while real wallet capacity is getting tighter, the sale becomes more expensive to win. A store can still move goods, but it may need more promotions, smaller package sizes, loyalty discounts, free shipping, or financing offers to do it. The register is not the same as the household budget Picture a shopper at a discount-store checkout with detergent, groceries, a pharmacy item, and a payment terminal waiting. The basket still clears. What changed is not the gesture. It is the math behind it. At home, the same household is deciding whether April's higher grocery bill means fewer restaurant trips, a delayed clothing purchase, a smaller debt payment, or one more revolving balance. The sale is real, but so is the tradeoff. That is why April PCE is not just a macro release. It is a read on pricing power. #Where

0
0
MWMarc Wood···5 min read

Dollar Tree Q1 Shows the New Math of Value Retail

TL;DR: Dollar Tree's first quarter was a useful consumer signal because sales growth came from higher tickets, not more visits. The company reported 3.5% comparable-store net sales growth, with average ticket up 4.5% and traffic down 1.0%. That is the real story for investors: value retail is gaining pricing room, but the shopper is becoming more surgical about each trip. #What Dollar Tree's Q1 Actually Showed Dollar Tree did not simply report a decent retail quarter. It reported a cleaner version of the household trade-down problem. In its first-quarter fiscal 2026 release, Dollar Tree said net sales from continuing operations rose 7.2% to $4.97 billion. Comparable-store net sales rose 3.5%. The uncomfortable detail sits underneath that comp number: average ticket increased 4.5%, while traffic declined 1.0%. That is not a normal victory lap. It says customers are still using Dollar Tree, but they are consolidating the trip. Fewer visits. More dollars per visit. More pressure on each item to justify its place in the basket. #Why Fewer Trips Can Still Be Good Business The casual read is easy: traffic down means demand is soft. The better read is more useful: Dollar Tree is becoming a checkout-level test of how much pricing flexibility a value retailer can take before the customer pushes back. The company has spent years moving away from a strict one-dollar identity. Its latest quarterly filing says comparable-store gains reflected higher ticket, partly from a higher mix of multi-price penetration. That phrase sounds like retail plumbing. It is really the business model changing in public. What the basket says Picture the checkout belt at a suburban Dollar Tree: paper towels, snacks, dish soap, a birthday card, maybe one small seasonal item that was not on the list. That shopper is not browsing the store like a mall. She is doing household math in real time. If gas, groceries, rent, and insurance are all taking a bi

0
0
JMJoshua Morgan···5 min read

The .25 Trillion Credit-Card Balance Is a Cash-Flow Test

TL;DR: U.S. credit-card balances dipped seasonally in Q1 2026, but the real story is not consumer relief. The New York Fed still shows $1.25 trillion in card debt, serious card-delinquency flow around 7.1%, and rising credit limits. That combination says credit cards are becoming a cash-flow bridge for households and a pricing test for banks, retailers, and investors. #What the Credit-Card Data Actually Says The easiest mistake is to see a quarterly balance decline and call the consumer healthier. The New York Fed's Q1 2026 household debt report says credit-card balances fell by $25 billion in the first quarter, to $1.252 trillion. That sounds benign until you notice the annual change: card balances were still up $70 billion from a year earlier. The same report says aggregate card limits rose by $60 billion in the quarter. Lenders are not simply watching borrowers deleverage. They are still extending room. That is the business story. Why a lower balance can still mean more stress Credit cards seasonally improve after year-end spending, tax refunds, bonus payments, and household budget resets. A Q1 dip is not the same as a durable paydown. The better question is whether households are paying cards down because cash flow improved, or because they are temporarily using tax-season liquidity to reset before borrowing again. For banks and retailers, that distinction matters more than the headline balance. #Why Cards Are Becoming a Cash-Flow Product At a kitchen table, the card balance is not an abstract liability. It is groceries, a utility bill, an auto repair, a medical copay, and the line between paying this week or waiting for the next paycheck. That is why the Federal Reserve's March 2026 consumer credit release is worth reading next to the New York Fed report. Revolving credit increased at a 3.8% annual rate in Q1, and the rate on credit-card accounts assessed interest was 21.52%. At that price, a card is not cheap liquidity. It is expensive working capital for households. The hidden implication is simple: the credi

0
0
AAAaron···4 min read

U.S. Jobless Claims Point to a Rehiring Problem, Not a Layoff Shock

TL;DR: U.S. initial jobless claims rose to 215,000 for the week ended May 23, according to the Labor Department's May 28 claims release, but the sharper business signal is not mass layoffs. It is slower re-hiring. A labor market can look calm from the employer side while becoming more expensive for households, lenders, and retailers that depend on fast income replacement. #What the latest U.S. jobless claims actually say The weekly claims number is still not screaming recession. Initial claims moved up by 5,000 to 215,000, and the four-week average rose to 209,000. That is a mild move, not a rupture. But the useful read is in the shape of the labor market. Layoffs are low enough to keep the headline quiet, while hiring is slow enough to make a job search feel longer than the macro chart suggests. Reuters, via The Star, noted that claims have stayed in a 190,000 to 230,000 range this year. That range is exactly why the story is easy to miss. This is not a firing wave. It is a waiting room. #Why a low-layoff labor market can still hit consumer finance The consumer economy does not only care whether someone loses a job. It cares how quickly income resumes after the job is gone. Picture a household at the kitchen table with a benefits page open, a bill stack to the side, and a job board that keeps returning "viewed" instead of "interview scheduled." Nothing about that scene has to show up as a dramatic claims spike. A few extra weeks without full pay can still change card balances, auto-payment timing, discretionary spending, and the willingness to take on a new loan. The cash-flow mechanism is smaller but more persistent The first missed paycheck is not the only problem. The second and third weeks are where the household starts turning a labor-market statistic into a balance-sheet adjustment. That is where the business i

0
0
AAAaron···4 min read

Kohl's Weak Quarter Has One Useful Signal: Cleaner Shelves

TL;DR: Kohl's reported a weak but less chaotic first quarter on May 28: net sales fell 1.7%, comparable sales fell 1.1%, and the company still lost $14 million. The useful signal is not a retail rebound. It is that Kohl's is trying to buy time with cleaner inventory, no revolver borrowings, and fewer financial leaks while its core low- to middle-income shopper remains selective. #What Kohl's Actually Reported Kohl's first-quarter fiscal 2026 release is not a victory lap. It is a stabilization document. Net sales were $3.0 billion, down 1.7% from a year earlier. Comparable sales fell 1.1%. Operating income dropped to $46 million from $60 million, and diluted EPS stayed negative at $(0.13). The cleaner part sits on the balance sheet. Inventory fell 8% year over year to $2.9 billion, cash rose to $429 million, and borrowings under the revolving credit facility were zero, compared with $545 million a year earlier. That matters because department-store turnarounds usually die from clutter before they die from one bad quarter. #Why Cleaner Shelves Matter More Than A Tiny Comp Miss Walk a soft apparel floor and the operating problem is obvious. Too much old product forces markdowns. Too little depth in the right sizes loses trips. A weak retailer can look busy and still be destroying margin if the floor is full of wrong inventory. Kohl's is trying to solve the less glamorous version of retail: not "how do we make shoppers excited again?" but "how do we stop every slow rack from turning into a cash drain?" The real bet is precision, not traffic Management said gross margin was 39.9%, up only 4 basis points. That is not dramatic. But a flat margin with falling sales and lower inventory is more useful than a promotional sales bump that leaves the company buried in clearance goods. The former creates optionality. The latter creates another markdown cycle. This is the overlooked po

0
0
TITim···5 min read

April PCE Turns U.S. Consumer Strength Into a Cash-Flow Test

TL;DR: The May 28 BEA data showed April U.S. consumer spending rising even as disposable personal income slipped, real disposable income fell 0.5%, and the saving rate dropped to 2.6%. That matters because the consumer story is turning into a cash-flow story: retailers, lenders, card issuers, and service businesses can still see dollars coming through the register while households have less room to absorb another price, rate, or billing shock. #What April PCE Actually Said The clean headline is that Americans kept spending in April. The messier business point is that they did it with less income cushion underneath them. The Bureau of Economic Analysis said personal consumption expenditures rose $111.1 billion in April, while disposable personal income fell $19.9 billion and real disposable personal income dropped 0.5%. That is not a consumer collapse. It is more uncomfortable than that. It is a consumer still showing up at the checkout counter, but with a thinner buffer between ordinary spending and forced tradeoffs. By the third paragraph, the point should be obvious: the important April number is not only spending growth. It is the spread between money going out and real buying power coming in. #Why the Cash-Flow Gap Matters More Than the Headline Nominal spending can flatter a business before it helps the household. BEA reported that current-dollar PCE rose 0.5% in April, but real PCE rose only 0.1%. Prices did part of the work. The PCE price index increased 0.4% for the month, and was up 3.8% from a year earlier. For a retailer, a health-care provider, a subscription company, or a restaurant group, that can still look like demand. The card swipe clears. Revenue is booked. The monthly sales dashboard is not empty. For the household, the same transaction looks different. A grocery receipt that is 5% higher is not a growth strategy. It is a claim on the next paycheck. The register sees revenue before the budget sees stress Picture the ordinary checkout scene: milk, paper towels, bread, a few house

0
0
TITim···5 min read

Student Loan Defaults Are Becoming a Credit-File Shock

TL;DR: The New York Fed's Q1 2026 household-credit data shows student-loan defaults have returned as a credit-file problem, not just a repayment-politics problem. The business implication is sharper than the headline delinquency rate: lenders, card issuers, auto dealers, landlords, and consumer companies may see credit access tighten for a narrow but real group before the broader spending data looks weak. #What Changed In Household Credit The New York Fed's Q1 2026 Household Debt and Credit Report says total U.S. household debt rose only $18 billion in the quarter, to $18.8 trillion. That is not the scary part. The student-loan line is the part worth watching. Student-loan balances were roughly flat at $1.66 trillion, but the share of balances 90 or more days delinquent rose to 10.3%. This is not a simple "consumers are collapsing" story. The New York Fed's own framing is more restrained: aggregate delinquency was little changed, and credit-card early delinquency even ticked down. The sharper point is that student debt has moved from a suspended line item back into the credit-underwriting machine. #Why This Is A Credit-File Shock The easy mistake is to treat student-loan delinquency as a monthly cash-flow story only. It is also a database story. A missed payment that returns to the credit file does not wait politely for the next retail sales report. It can show up when a borrower applies for a used-car loan, a private student-loan refinance, a rental apartment, a credit-limit increase, or a store card. Why the damage arrives before spending cuts The New York Fed's Liberty Street Economics analysis estimates that roughly 1 million federal student-loan borrowers defaulted in Q4 2025 and another 2.6 million defaulted in Q1 2026. It also found a 91-point average credit-score drop for defaulted borrowers between Q3 2024 and Q4 2025, using the older Equifax Risk Score 3.0 measure. That is the mechanism. A household can still buy groceries, keep a streaming plan, an

0
0
TITim···4 min read

The Market Is Pricing a Consumer Who Has Learned to Say No

The American consumer is not disappearing. That is the easy, wrong read. The more useful read is that the consumer is becoming a substitution machine. That matters more for investors than another debate about whether people are "resilient." A household can keep showing up in the spending data while quietly changing the whole profit map underneath retailers, banks, card networks, restaurants, and consumer brands. The scene is ordinary. Someone gets home from the store, puts the receipt beside a calculator, and realizes the bill did not explode because they got rich. It stayed manageable because the cart changed. The brand cereal became store brand. The impulse item disappeared. The larger purchase moved to next month. The family did not stop consuming; it edited the basket. That is the blind spot in the current market story. Consumer confidence slipped in May, according to the Conference Board, even as stocks hovered near highs. Its index fell to 93.1 from 93.8. More important than the headline number was the special survey question: roughly two-thirds of consumers said rising prices had caused them to cut back on spending overall. At the same time, private card data still shows the spending economy has not simply fallen over. Bank of America Institute's latest consumer work points to lower- and middle-income households easing back on discretionary purchases, while higher-income households continue to carry more momentum. Put those together and the picture is not "strong consumer" or "weak consumer." It is more specific: Affluent households are still buying convenience, travel, services, and premium goods. Middle-income households are still spending, but with more edits. Lower-income households are protecting necessities and stripping out optionality. That creates a different kind of consumer trade. The winners are not just the companies with the cheapest price. They are the companies that make substitution feel painless. A grocery chain with credible private labels is not merely selling cheaper cereal. It is selling permission to downgrade without feeling like a downgrade. A discount retailer with tight inventory is not just moving low-price goo

0
0
ECEthan Caldwell···4 min read

The Consumer Is Not Weak. The Basket Is Getting Smaller.

The interesting part of the latest consumer-confidence wobble is not that Americans are nervous. It is that they are still shopping, but they are quietly shrinking the commercial unit that every retailer, lender, and advertiser actually monetizes: the basket. That is a very different problem from a classic consumer collapse. A weak consumer stops showing up. This consumer keeps walking into the aisle, keeps paying the card bill, and keeps choosing one less item. The Conference Board's May survey put consumer confidence at 93.1, down slightly from April's 93.8. The headline is mild. The behavior underneath it is not: roughly two-thirds of consumers said they were cutting back on spending in some way, with many buying fewer items, postponing expensive purchases, or trading down. This is why the stock market can look cheerful while the checkout line feels tight. Equity investors look at records, margins, AI capex, and the idea that the economy keeps refusing to break. A household looks at a grocery receipt, a gas receipt, and a phone screen that turns next Friday's paycheck into a set of already-spoken-for numbers. Those two realities can coexist for a long time. At the kitchen table, the decision is not framed as "consumer confidence." It is a tiny operating review. The household does not need a recession call. It asks: Can the big box run wait another month? Is the second streaming service still worth it? Do we buy the brand, the private label, or nothing? Is the card balance still moving in the right direction? That last question is the one businesses should care about. The American consumer has become very good at staying in the game. That skill makes macro data look resilient. It also makes company-level demand harder to read. A retailer can still report traffic and lose basket. A restaurant can still fill tables and lose add-ons. A bank can still grow card receivables while the best customers become more selective. A subscription company can still avoid mass churn while customers downgrade, pause, or cancel the least essential line item. ![](https://api.gainbrief.com/storage/v1/object/public/post-covers/37b97f7f-b772-4610-9b18-b828b8c86d5b/

0
0